Whereas it was once noise, meteorological data became signal when lone cars developed into fleets. This post describes how driverless car developers are turning this signal into value as meteorological surplus.
This is the third and final part of a series on driverless cars and meteorology. Read part 1 and part 2. I adapted these posts from my writing in John Durham Peters’ Elemental Media seminar.
Meteorological Surplus
As individual test cars developed into autonomous ridesharing fleets, driverless car operators have found new value in weather data. In their view, what figures as noise for individual cars refigures as signal for whole fleets. At present, weather signals promise value in three ways. First, recall that driverless cars’ operational design domains are still largely restricted to calm weather conditions. To determine when the weather allows for driving, driverless car operators currently rely on external sources of meteorological data. As Waymo’s weather team notes, however, external data typically covers a wide geographic area at low resolution, and so it may not accurately reflect surface conditions in a car’s immediate surroundings. By collecting hyperlocal data, driverless cars determine for themselves whether they can drive, and potentially with greater accuracy. In this way, they could increase their total time in use—and thus in business. Second, fleet operators can compile data across their cars to leverage the signals further. When one car senses prohibitive weather, the rest of the fleet can dynamically reroute their trips to avoid the area, again promising more driving time. Third, some bad weather may be good for business and thus worth pursuing: rain, for example, might convince pedestrians to hire a car in hopes of staying dry. Provided that the cars can drive through it, this weather can actually improve business. With information about local rain conditions, fleet systems can dynamically route unoccupied cars towards areas with more rain-business. Across these applications, weather data can enable driverless car developers to operate their fleets more efficiently, thereby increasing potential profits. At the level of fleets, weather data contains meteorological surplus value.
To accumulate this surplus, Waymo now employs its vehicles as “mobile weather stations” that continually collect hyperlocal, surface-level weather data. Leveraging the cars’ wireless connection to a central operating hub, it compiles individual datapoints into what meteorologists call mesonets. Using this compiled data, it creates real-time visualizations like regional fog maps. Touting the value of such maps, Waymo’s meteorology team argues that its cars outperform the immobile stations typically found at high elevations. As they describe it, these traditional stations struggle to produce accurate surface-level observations, forcing meteorologists to infer ground conditions from high-elevation data. In his history of meteorology, Paul Edwards (2010, 21) likewise notes a decline in surface-level data quality due to the disappearance of surface stations during the past three decades. In this context, Waymo sees its own technology, though originally designed for a different purpose, as more reliable. In the process, it enacts John Ruskin’s vision for meteorology: “to have at its command, at stated periods, perfect systems of methodical and simultaneous observations…to know, at any given instant, the state of the atmosphere on every point on its surface,” (Ruskin 1839 quoted by Edwards 2010). Yet one may very well question whether this is meteorology—etymologically the study of phenomena “up high”—as the cars only collect data relevant to their navigation—data at the surface.
Waymo continues a long history of compiling data into weather maps. For example, in 1686, British astronomer Edmond Halley developed a theory of global heat circulation from the accounts of British navigators (Edwards 2010, 29). In 1848, Matthew Maury, a US Navy Officer, compiled wind and ocean current data from the logs of ships. His data books reduced trip times, established an international weather data collection network, and initiated “the longest continuous quasi-global data record” (Edwards 2010, 35). Later in the 19th century, Euro-American militaries developed weather telegraphy systems to quickly transmit weather data over vast distances. Given its speed, weather telegraphy enabled continental mapping of individual weather systems as they unfolded. As telegraph networks developed, they became meteorological sensors themselves. Telegraph lines were sensitive to rain, leading to interruptions in communication during storms. Sensed by telegraph operators in other locations, these interruptions became indicators of incoming rain (Blum 2020). Noise became indexical signal.
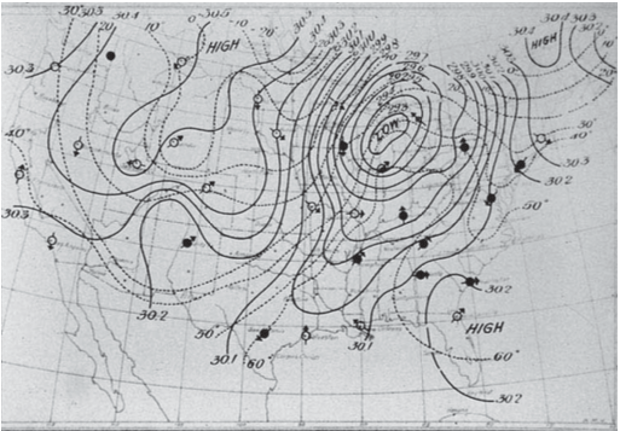
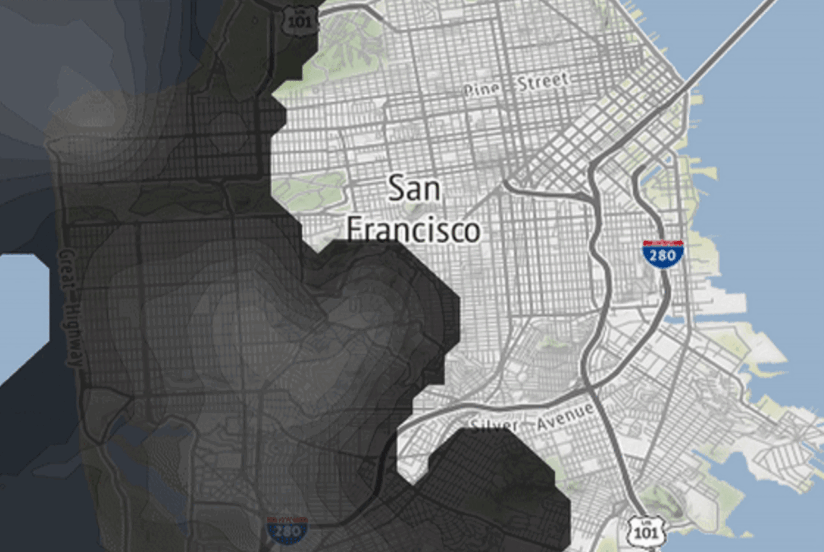
Waymo’s fog map reinscribes these historical meteorological networks’ key features. Like the naval networks, it compiles data from vehicles navigating the planet’s surface and repurposes data originally collected for navigation. Like the military networks more broadly, it compiles weather data to improve fleet operations. Now in a civilian context, the resulting improvements can increase corporate profits. And like all of these earlier networks, its geographic scope is limited by control over physical space. Compare figures four and five, for instance: the isotherms in figure five correspond with the borders of the mainland United States just as the shaded regions in figure four remain in Waymo’s legal operating zone. This zone does not include downtown San Francisco, and thus it remains unshaded in the map. Such maps in turn reinforce a fleet’s control over space, be it a naval fleet’s control over the seas or a ridesharing service’s control over city streets. Finally, as in the case of weather telegraphy, Waymo vehicles invert noise and signal, turning disruptions in sensor perception into meteorological indicators. In both cases, interruptions become indicators at larger scales.
Each of these parallels demonstrates how technical media condition the spatialization, temporality, and form of meteorological phenomena. Depending on the medium, weather can be experienced as global, continental, or local. Our knowledge of it can bias the land or the sea, the city or the country. Weather data can denote climate, rooted in averages over longer time-scales, or weather, rooted in events at specific moments. It can measure scalar intensities or indicate a weather condition’s binary presence or absence. Such conditioning is unavoidable, for as Hsin-Yuan Peng writes, “scientific visualization constitutes a meticulous act of forging rather than passive recording” (2022, 92). All acts of forging are subject to the technical capacities, operational needs, and arrangements of power embedded in the medium. As weather mediates driverless cars’ relation to the road, the cars in turn mediate the weather, refiguring it in the process.
References
- Blum, Andrew. 2020. The Weather Machine: A Journey inside the Forecast. New York, NY: Ecco, an imprint of HarperCollins Publisher.
- Edwards, Paul N. 2010. A Vast Machine: Computer Models, Climate Data, and the Politics of Global Warming. MIT Press.
- Peng, Hsin-Yuan. 2022. “Intervals in Relief: Abe Masanao’s Stereoscopic Clouds.” Representations 159 (1): 90–121.
